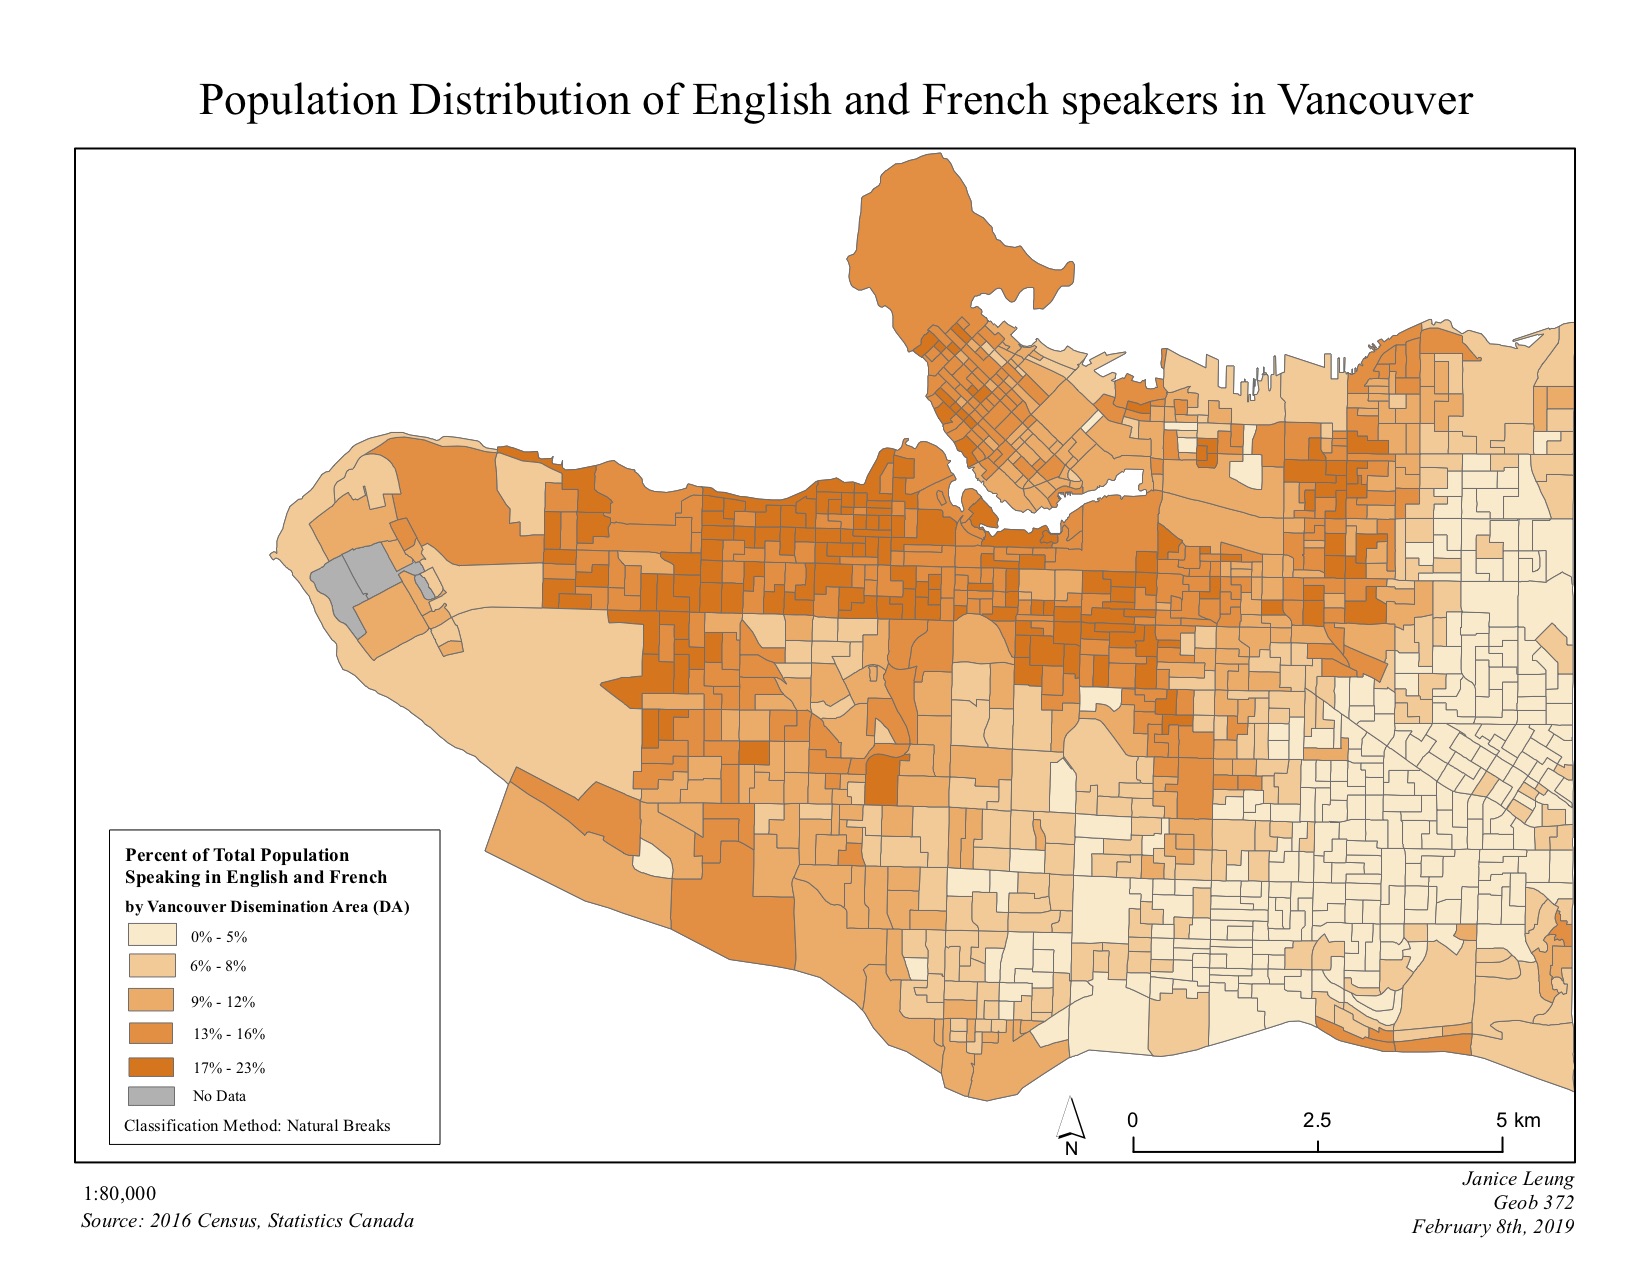
I was tasked to use ArcGIS to create a choropleth map for an audience of my choice. I chose to use choropleth maps to display the data as choropleth maps are the most common type of quantitative thematic map and they best display normalized data across spatial units.
In this scenario,
- the target audience for this map would be the immigrants from countries that have French as their official language such as Belgium, Chad, France, Haiti etc who want to immigrate to Vancouver and at the same time looking for a neighbourhood which people speak both French and English.
- In this way, it would be easier for the immigrants to adapt to the new living environment.
By using 2011 Canadian Census data, I have normalized the data of the number of speakers who speak both English and French to the total population so as to get the percentage of people who speak both languages within each DA unit.
Data Classification:
Different classification schemes can drastically change how you visualize and understand the data. There is no perfect classification scheme to classify for one's data set, you will have to choose a classification scheme which most effectively display your specific data.
In this week's project, I used the natural breaks classification for my map. This method is known for grouping similar data together - reducing variance within classes and maximizes the difference between classes. This is useful to my data set because using by using this classification method, my map is able to display areas of which English or French speaking communities grouping together to the closest similar values. Readers can have a better understanding of the map when looking at data class that are grouped by similar values, which won’t create too much confusion. It helps to emphasize which neighbourhood in Vancouver has the most English and French speakers, thus can guide the immigrants to find the most suitable place for them to settle down.
Skills I Picked Up Through This Project:
- Create a choropleth map on ArcGIS using 2011 Canadian Census data
- Making decision on which classification method is the most effective to display my dataset
Learning Significance