(Don't be shy. Click to enlarge the image)
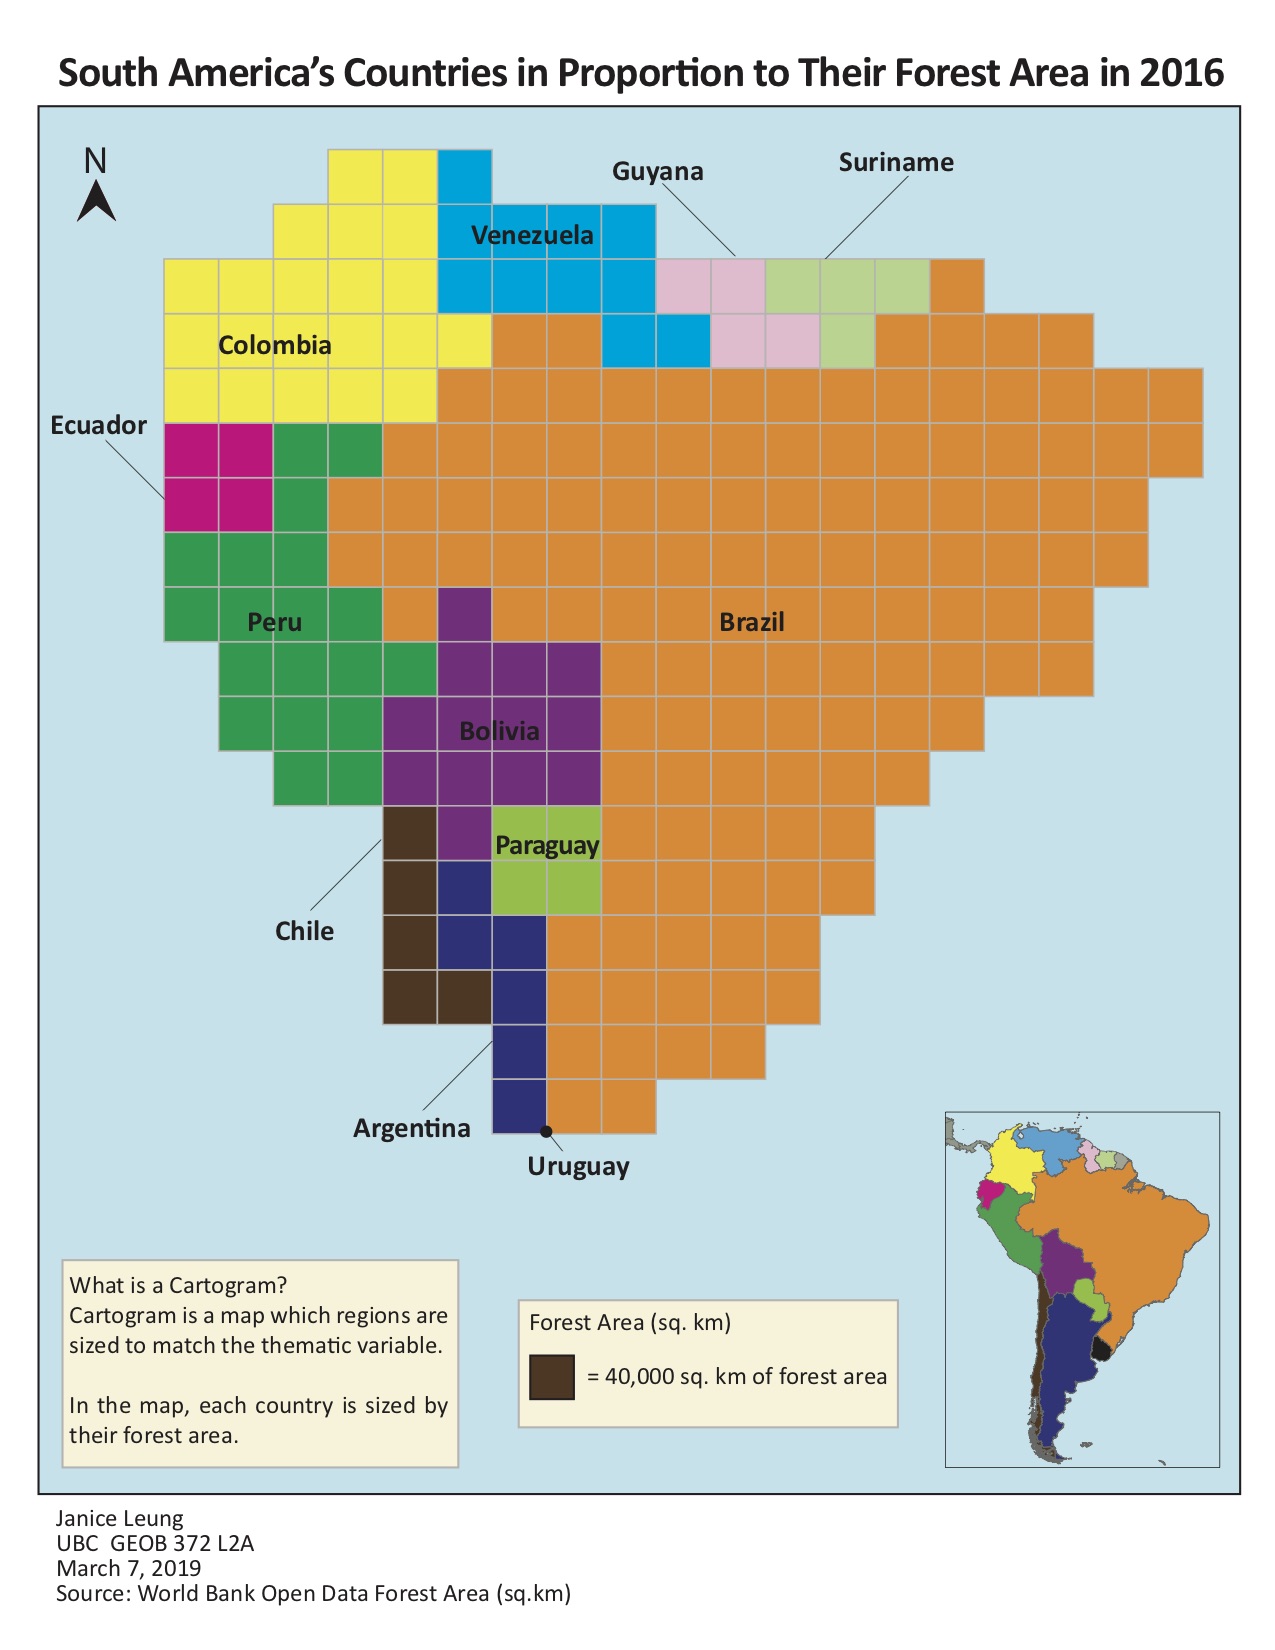
This week I was tasked to present the forest area data of different South America's countries in a cartogram map by using Adobe Illustrator.
What is cartogram?
- Cartogram is a map which regions are sized to match the thematic variable.
- The geometry of of different countries on the map are distorted in order to convey the statistical information through diagrams by proportion.
In the map, each country is sized by their forest area. In this assignment, I first acquired the forest data of each South America countries from World Bank Open Data Forest Area (sq.km). I then had to decide how much sq. km of forest area each grid (1cm x 1cm) has to represent on the map based on the size of the A4 paper. In this way, it thus helps me to further decide the number of grid squares I need to represent the forest areas for each country. The number of grids is proportion to the forest area of each South American country. After determining all the statistical information, I then had to place the grids in the shape of South America to visually present which country in South America has the most forested area.
Skills I learnt in this assignment:
- Calculate the number of grid squares I need to use on Excel in proportion to the forest areas to best fit the paper size of the cartogram map
- Create an inset map
Learning Significance