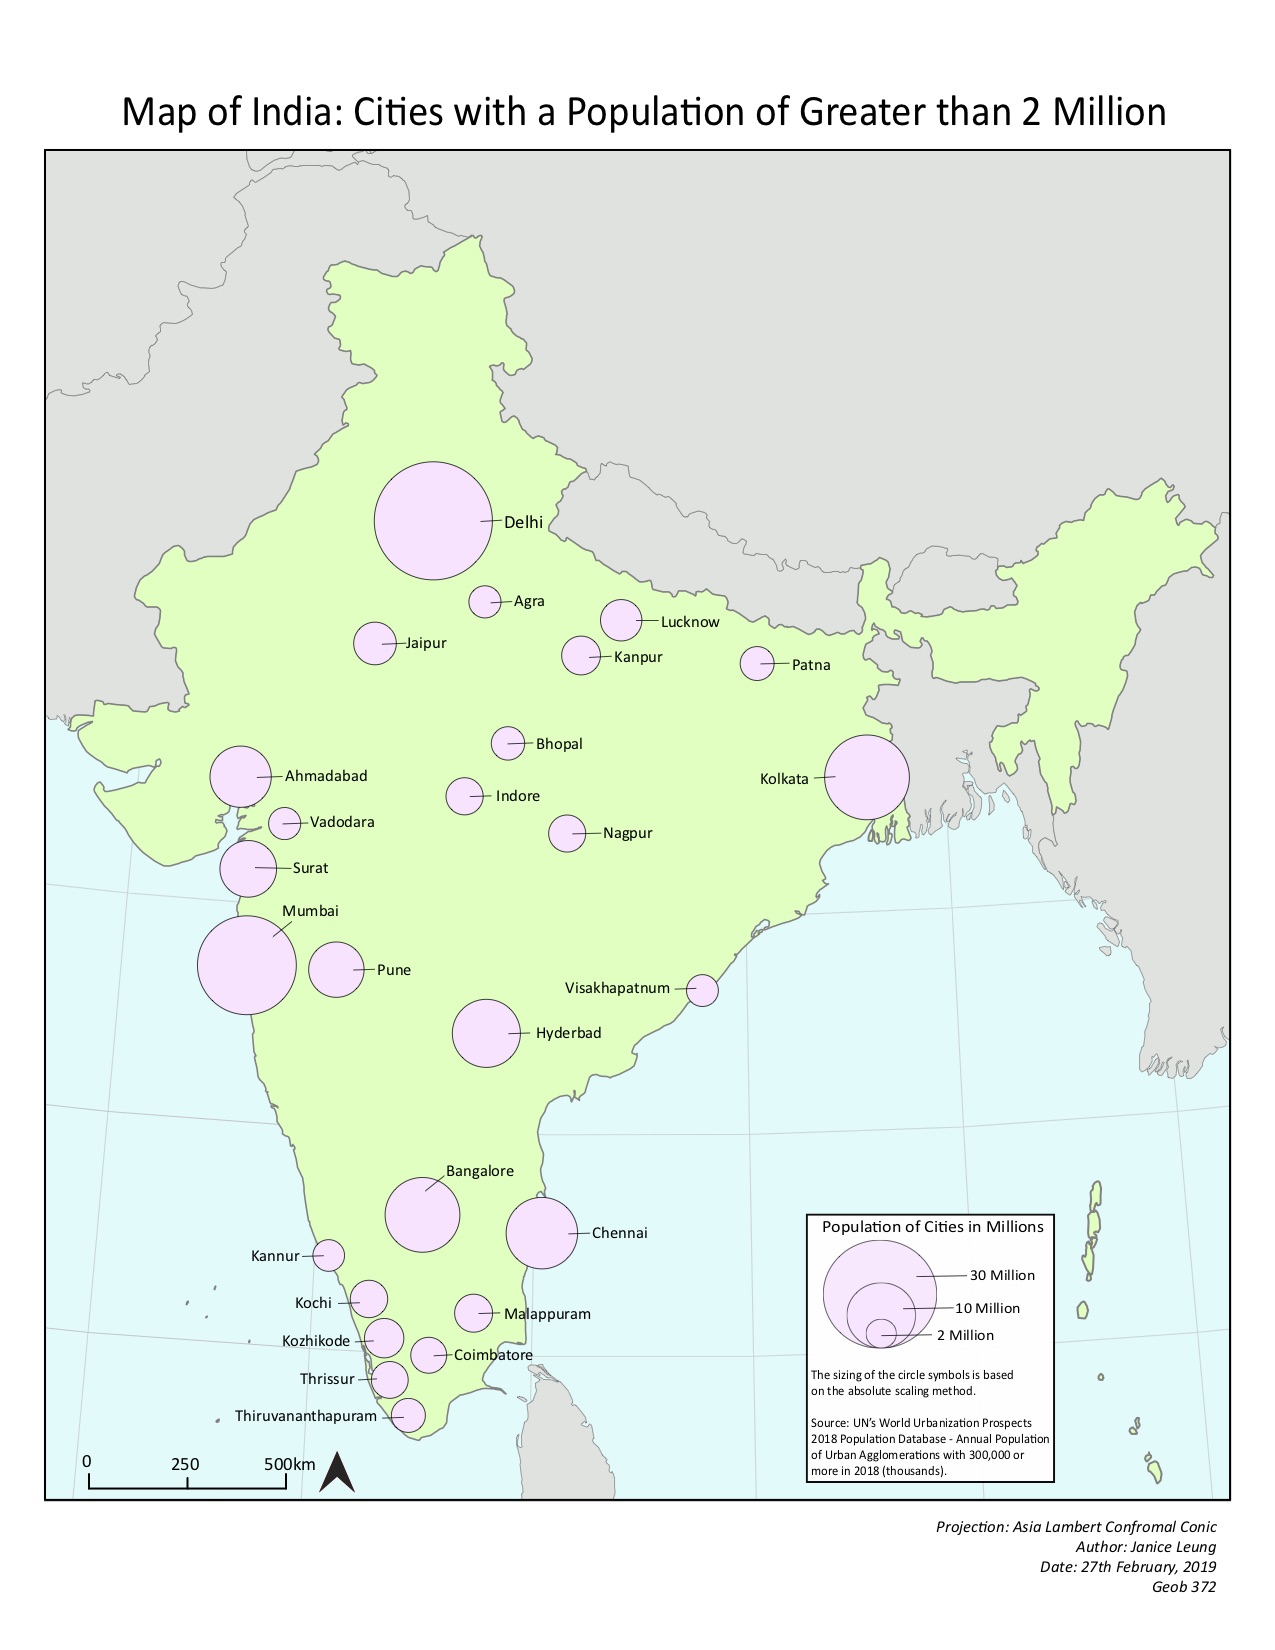

This week I created a proportional symbol map of major cities in India through ArcGIS and Adobe Illustrator. The two maps are by absolute and perceptual scaling respectively.
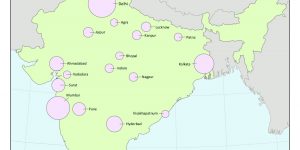
Absolute Scaling
- Absolute scaling is when the size of the circle or symbol is in direct proportion to the value of the data. For example, if you have a reference city of 1000 people and a city of 2000 people, the circle size of the city with 2000 people will be twice the size of the reference city circle and so on.
- Pros of using the absolute scaling method: the size of the circles correspond with the magnitude of the value(s); the circles are scaled by calculation and depict perfect lengths. This leads to easy estimation for the map user when glancing over proportional symbol maps.
- Cons of using the absolute scaling method: people have a perceptual underestimation which means that they tend to visually underestimate the area and volume of the circles leading to an imprecise representation of the values displayed. They are then unable maybe in relation to another circle that may symbolize an immensely smaller value, but look relative size.
Perceptual Scaling:
- Perceptual scaling has a similar definition as the absolute scaling but is that the perceptual scaling would take into consideration of human perception. Using the same example as about absolute scaling, if a reference city has a population of 1000 people, the circle size for 2000 people would not just be twice as big as the reference city circle, it could be even bigger than that. As people tend to underestimate the area and volume of larger areas, in this case Flannery came up with an alternative scaling method - perceptual scaling method. This method tends to keep the largest circle the same size but minimizes the smaller circle to create a larger perceptual difference.
- Pros of using perceptual scaling method: It can give the map users a more accurate estimation of the circle values (accurate estimation includes value, area and volume). This leads the map to be more map user friendly and allow for more contrast to the eyes.
- Cons of using perceptual scaling method: It can lead the map user to be inaccurately informed of the value that the proportional symbol represents because the circles do not represent true values.
For my own "Cities in India" map, I prefer using the perceptual scaling for non-technical purposes such as comparing visually the population of India to Canada with the elementary children. Whereas I would use the absolute scaling for statistics and analytics etc that requires further calculations. For the India map example, I would choose the perceptual scaling map as the human eye is able to perceive the circles better and have an overall stronger visualization of population sizes.
Skills I Picked Up Through This Assignment:
- Calculate the size of proportional symbols appropriate to each data value using Excel
- Determine the best proportional symbol size for perceptual scaling using Adobe Illustrator and ArcGIS
Learning Significance