In the City of Vancouver, there are always many tsunami, flooding or storm surges issues. In order to know more about the potential impact of this extreme weather, I have created four maps to highlight the potential areas which are at risk to flooding or a storm surge.
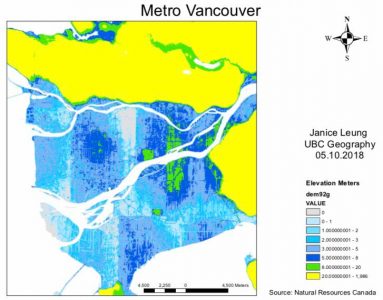
The first map is an overview of the elevation level of the Metro Vancouver. Places shaded in light blue such as Richmond and downtown Vancouver are at low elevation. These places are highly vulnerable to flooding and storm surge.
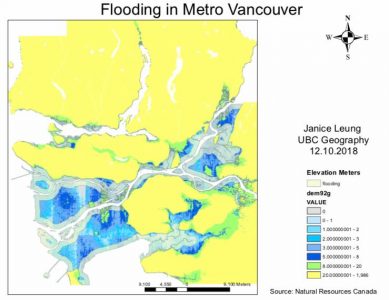
The second map I added a 1 km buffer to show areas for possible storm surge.
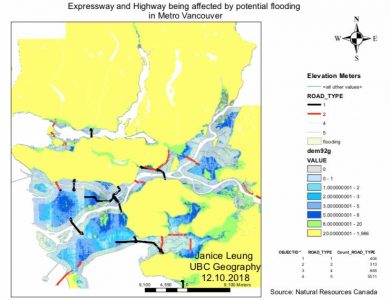
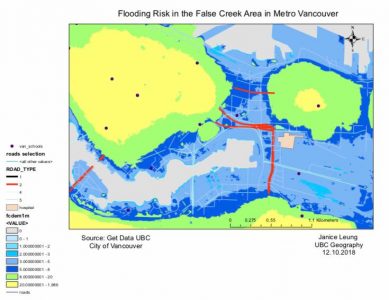
The third map demonstrates which expressway and highway will possibly affected by storm surge.
The fourth map shows a map of schools and the new St Paul’s hospital location that could be affected by potential flooding.
After creating and analyzing the four maps, I have come up to a conclusion that
- Areas which are 8 meters or below at elevation are possibly affected by storm surges and flooding.
- Major highways and expressways will also be affected. Most of the roads are across rivers such as from Richmond to Delta.
- There are 6 schools in the the flooding zone are found in downtown Vancouver near to the False Creek area
- Comparing the “Flood Zones in Metro Vancouver” map and “New St. Paul’s Hospital map, it shows that the hospital is being built in an area that is also in danger of flooding and storm surges.
Error and Uncertainty
There are also errors and uncertainties in the map. The DEM92g resolution is 25,25 which is relatively low. With poor resolution, it is difficult to analyze the map as you cannot even see the details clearly. In order to provide a better analysis and understanding of the map, we need to use a higher, finer resolution for the map. The resolution of the downtown False Creek (fcdem1) that part is 1,1. It is so much finer than DEM 92g. Therefore, it is easier to do analysis on the downtown False Creek that area.
New skills acquired
- Reclassify raster dem to show only the low elevation areas & convert raster layer to vector layer
- Perform buffer proximity analysis
- Combine the 1 km buffer and the lowlands (10m and under) with polygon overlay tool intersect to create area of potential flood from storm surge (low elevation, within 1km shore)
- Digitize new layer of outline of new site for St. Paul’s Hospital
Learning Significance